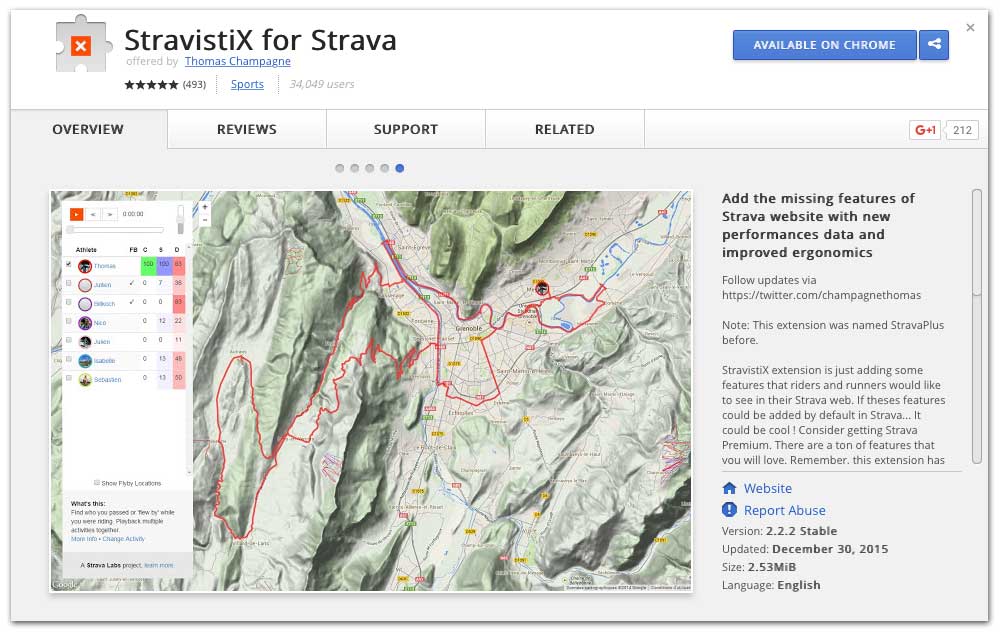
Formerly known as StravaPlus, the recently updated StravistiX extension for Google Chrome takes all your Strava data and creates a cornucopia of new data sets, comparisons, charts, graphs and more to make the most of your metrics.
Once installed, simply go to your Strava homepage as normal (on Chrome) and you’ll start to notice a few new buttons and options. On the Activity Feed, the “Go To Flyby” feature (shown above) from Strava Labs is conveniently below each activity, whether it’s yours or someone you follow. Click on one of your own activities and the real fun begins…
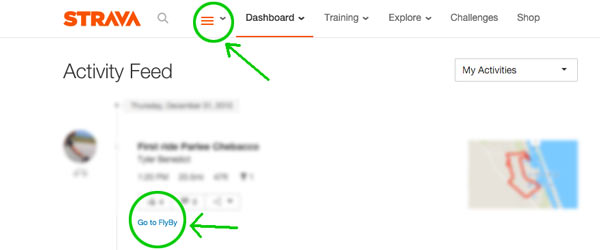
To get started, download the extension here. Then log into your Strava account and check out the new orange hamburger to the left of your usual tabs. Also note the Flyby link under each ride. Drop down the new menu to access the enhanced settings.
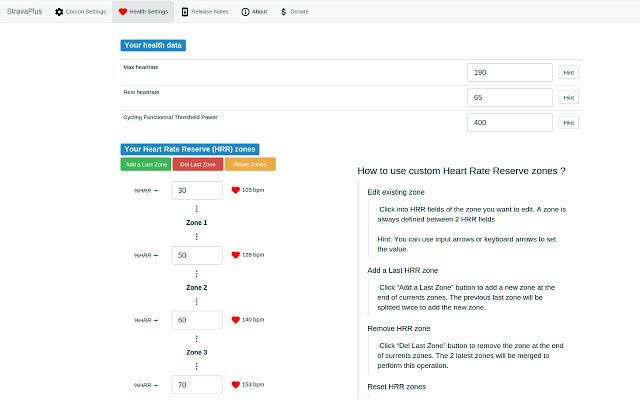
There, you’ll be able to set a massive array of settings for both health and performance zones and criteria. Click on a ride you’ve done and there’ll be a large orange button on the right that says “Show Extended Statistics”. Click that and you’ll see something like this, which takes a lot of the Premium account features and shows them in minute detail:

Keep scrolling until you get number overload.
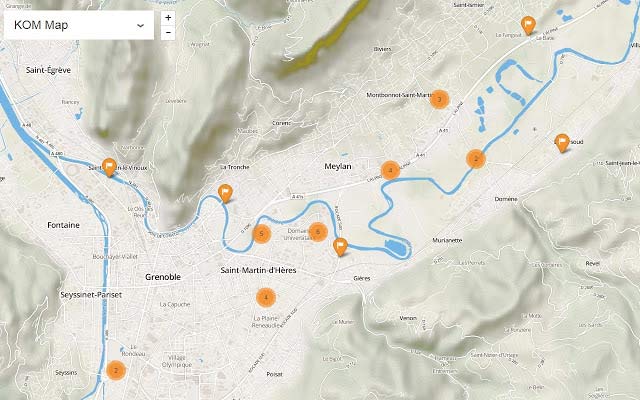
The StravistiX menu also offers quick access to KOM/CR and Heat Maps currently found in Strava Labs.
StravistiX is the brainchild of Thomas Champagne, a programmer in France, and here’s what he had to say about its development:
“I created it because I started cycling approximately four years ago. I did it as training for freestyle skiing, but I dove into cycling and loved the efforts. And I’m kind of a geek. I’m a computer science engineer, and I’m loving the metrics and measurements of everything I do. The information I wanted about my ride was insufficient or irrelevant on Strava or Garmin Connect or Endomondo, but I wanted it all in one place. Something like an average speed of a ride can tell me nothing, especially if you’re doing a ride of 100km where I may cross a city with red lights and cars that slow me and have a huge impact on my average speed. So I introduced Quartile measurements, which gives a more accurate impression of your average speed at the 75th quartile.”
Thomas explained that quartile speeds essentially measure your average speed in segments, eliminating the fastest or slowest quarters or halves. So, if you hammered for most of the ride but then had to cool down or wiggle through neighborhoods to get home, the 75% quartile measures the fastest 75% of your ride and averages it to show what you were really doing while hammering.
Adding to that is TRIMP (TRaining IMPulse), which takes your heart rate data and calculates the stress load put on your heart by a workout. It’s similar to Strava’s Suffer Score, but more accurate. Another great feature is that you can click on any of these numbers and see the calculations used and a technical description of them.
All of the data is pulled directly from Strava’s website, not via any API, so it’s all done in the background once you load the page, but that means it’s only working through the Chrome extension and not an app. The plugin is free and is constantly being updated. If you like, you can donate through the plugin to support further development. The current list of improved features and metrics include:
ACTIVITIES IMPROVEMENTS
- Zone distribution through charts and tables of:
- Speed/Pace: Quartiles, standard deviation, …
- Cadence: Quartiles, Pedaling/freewheel time, Crank Revolutions
- Heart rate reserve: Quartiles, Training Impulse
- Power: Quartiles, Variability Index, Punch Factor, Weighted Watts/Kg
- Grade: Quartiles, Grade Profile, Times and percentages during climbs, flats and downhills
- Each zones for each data type is customizable in Stravisitix Options.
- TRIMP (Training Impulse) score. The TRIMP is a number calculated according to the time spent in heart zone, to determine the training load. ( http://fellrnr.com/wiki/TRIMP )
- TRIMP / Hour
- Ratio of activity: time moving over total time of an activity.
- Thoughness Score: global involvement score into in the activity. It represents your motivation into activity. This score is based on the ratio of activity, elevation, average speed, and distance. (Coming soon for running)
- Weighted power cycling
- Weighted power / kg in cycling
- Cycling variability index. This index shows activity smoothness in terms of effort Cycling intensity index or Punch Factor.This index indicates you were below or beyond of your current power capacity (Functionnal Power Threshold)
- Distance display for each bike in activities
- Choosing the type of default Google map
- Integration VeloViewer in each of your activities
- “FlyBy” integration: People who make sports with you.
- OpenStreetMap flipper. Available osm maps: Cycle, Landscape, Street, Os, Outdoors. Garmin TCX export.
- Weather for cycling activities
SEGMENTS IMPROVEMENTS
- Exporting cycling segment effort as Virtual Partner course for your Garmin device or other compatible GPS. File format: .crs, .tcx, .gpx
- % rank in segments
- Nearby segments around watching segment.
- Default order in segments: All, Man, Woman, People I am, My results
OTHER COOL THINGS
- Integration KOM/CR map
- Integration of Heat Map Global Strava
- Hidden challenges or/and roads created in the Dashboard
Inside the new options are links to VeloViewer for additional insights mapping and Segment insights, but those require a Strava Premium and/or VV Pro account to fully enjoy.
Download StravistiX for Chrome here. Thomas says he may develop plugins for Safari and Firefox in the future, but offers no timeline. The project is open source, so if you want to help, reach out via his GITHUB website.